
Java Debugging with Eclipse
Debugging is the process of identifying and fixing any issues in the source code of a program. Modern IDEs like Eclipse provide debugging tools that make it easier for developers to walk through their code interactively and inspect it to spot and resolve any issues.
Debugging support in Eclipse
Eclipse allows running an application in Debug mode which helps with stepping through each line of code in a program. Eclipse also provides a Debug Perspective which is a set of views grouped together that help inspect code and make the debugging process very effective.
Let’s walk through the steps of debugging a Java application with Eclipse using a simple program, as shown below:
public class EclipseDebuggingExample {
    public int add(int a, int b) {
        int result = a + b;
        return result;
    }

    public static void main(String[] args) {
        EclipseDebuggingExample ede = new EclipseDebuggingExample();
        int a = 3;
        int b = 7;
        int result = ede.add(a, b);
        System.out.printf("%d + %d = %d", a, b, result);
    }
}
Two simple methods main()andadd()are defined in the above code example. The main() method calls the add() method to add two integers a and b and return their sum. The steps for debugging this program are shown below:
Step One: Set Breakpoints
A breakpoint is a point in code where the program execution pauses during debugging. This allows the programmer to inspect code and the flow of execution at the defined breakpoint.
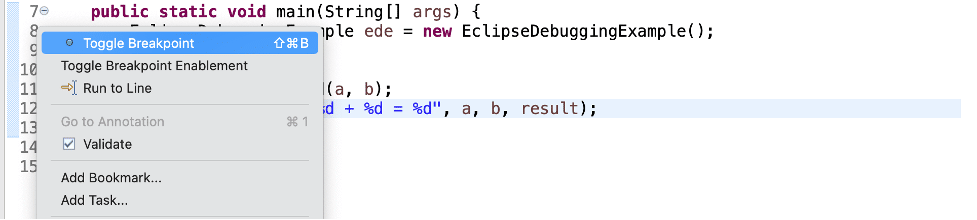
To define a breakpoint, either double click on the left margin in the editor or right click and select Toggle Breakpoint:
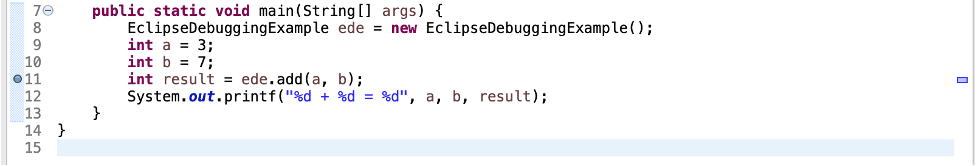
A blue circle should then appear next to the line:
Step Two: Start the Program in Debug Mode
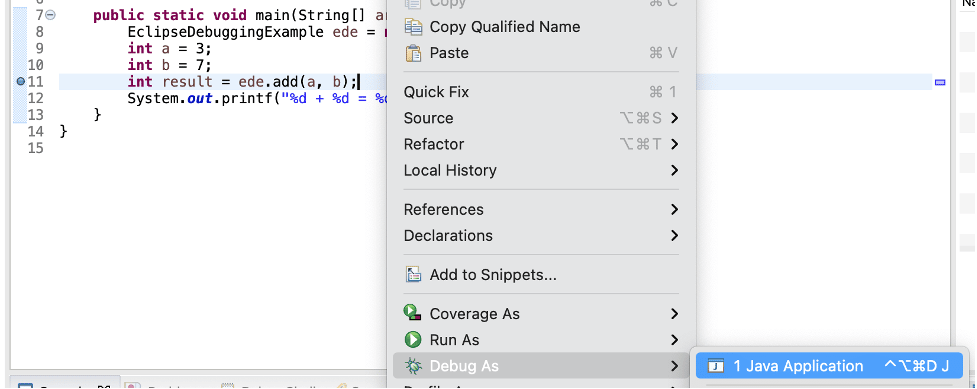
To debug the application, either right-click on the file in Package Explorer or within the Java editor and select Debug As -> Java Application:
Eclipse asks if you want to switch to the Debug Perspective when a breakpoint is reached:
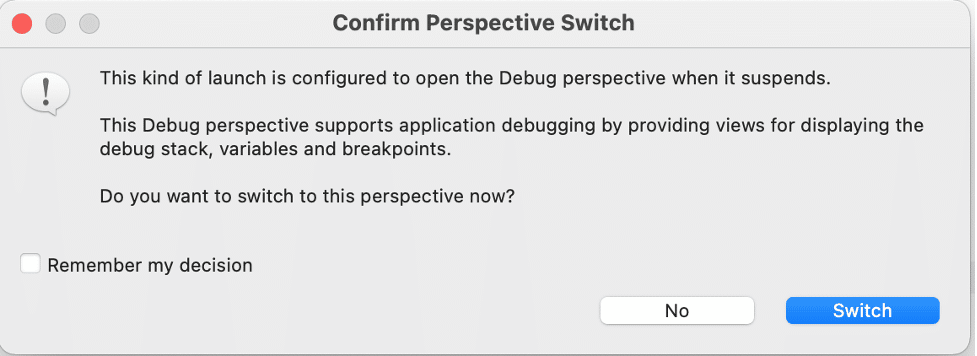
If you click Switch, Eclipse opens this perspective, which has a group of views that help with the debugging process:
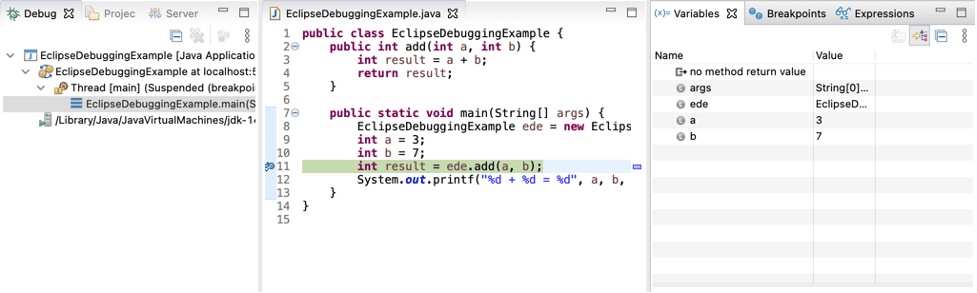
The most commonly used views are described below:
- Debug: Displays the call stack which helps in determining the flow of execution of the program until the breakpoint is reached
- Variables: Displays fields and defined variables in the current stack
- Breakpoints: Shows a list of all breakpoints in the code and enabling/disabling breakpoints
- Expressions: Allows defining custom Java expressions to inspect their values
Eclipse also provides several buttons in the toolbar for controlling the flow of execution of the program:

The most commonly used buttons are described below along with their corresponding keyboard shortcuts:
| Feature | Key | Description |
|---|---|---|
| Resume | F8 | Resumes normal execution of the program until the next breakpoint is reached. |
| Step Into | F5 | Executes the current line of code and dives into the next line of code in the program execution. If the current line calls a method, the debugger steps into the method. |
| Step Over | F6 | Executes the current line of code and goes to the next line without stepping into any method calls or associated scope (e.g. loops and conditions) of the current line. |
| Step Return | F7 | Steps back out of the current method and returns to the caller of the method |
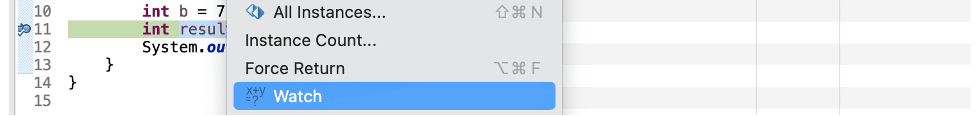
Step Three: Add Variables to Expressions for Examination
Any custom Java expressions (including variables) and their values can be inspected in the Expressions view. For example, to track the value of the a, b and the result variables, they can be added to the Expressions view by right-clicking on each and then clicking Watch:
Step Four: Check the Variables Values in Expressions
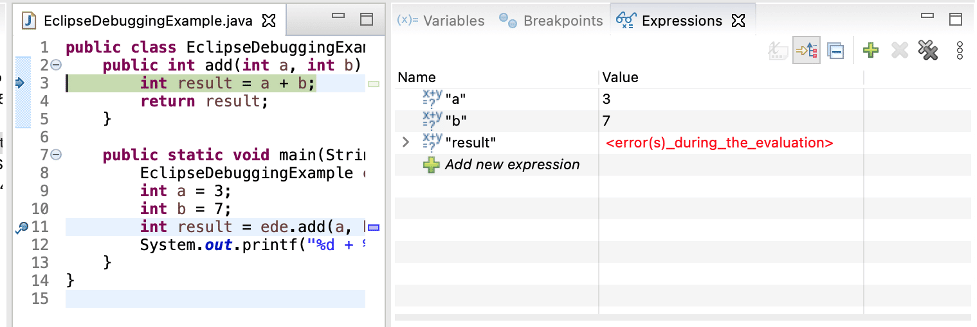
The variables are now visible in the Expressions view:
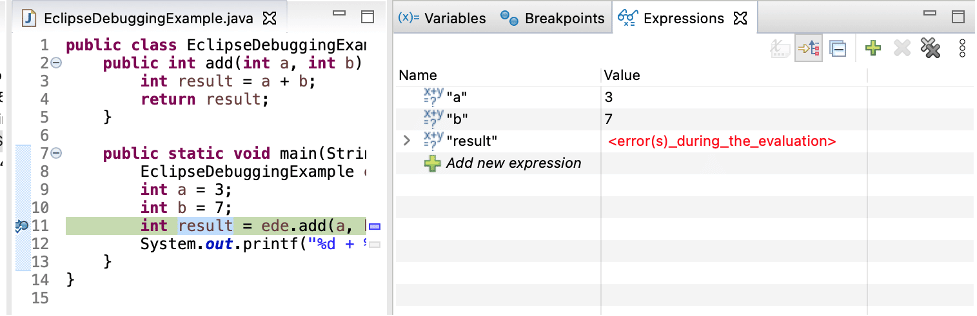
The a and b variables show their correct value in the Expressions view. However, since the result variable isn’t declared at this point, it shows an error in the Value column. This should show a proper value after the current line of code is executed.
Step Five: Step Into the Function
Press F5 or the Step Into icon to enter into the add method:
Step Six: Step Over
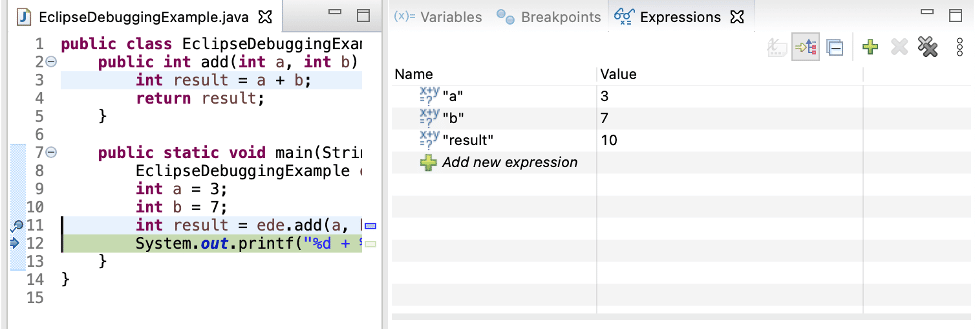
Press F6 or the Step Over icon to execute the current line of code and go to the next one:
As seen in the image above, the result variable evaluates as expected.
Step Seven: Check the Return Value from Function
Press Step Over again to return to the main() method:
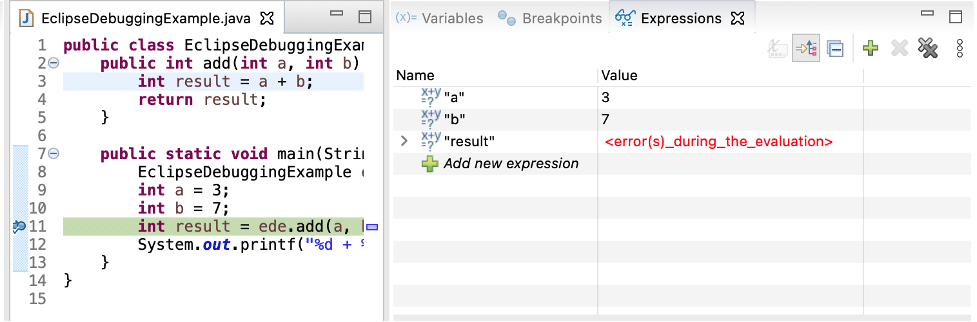
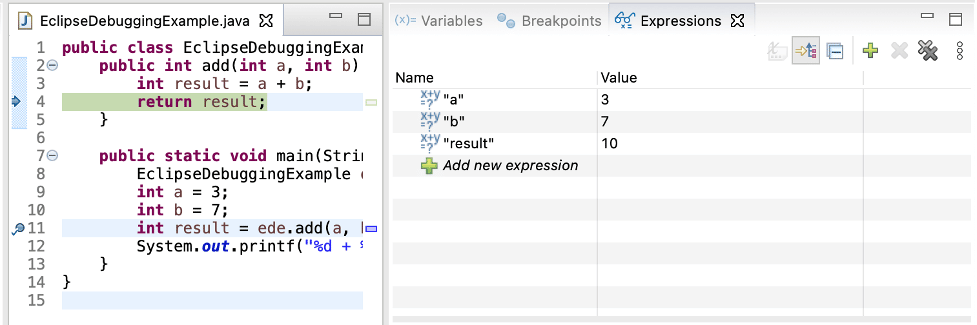
The debugger returns to stop on the same line where it left previously in Step 5. Press Step Over again to check the return value from the add() method:
As expected, the result variable evaluates correctly to the value returned by the add() method.
Step Eight: Set Debug Filter
At this point, if you press Step Into (F5), the debugger will dive into the Java.lang.Integer class:
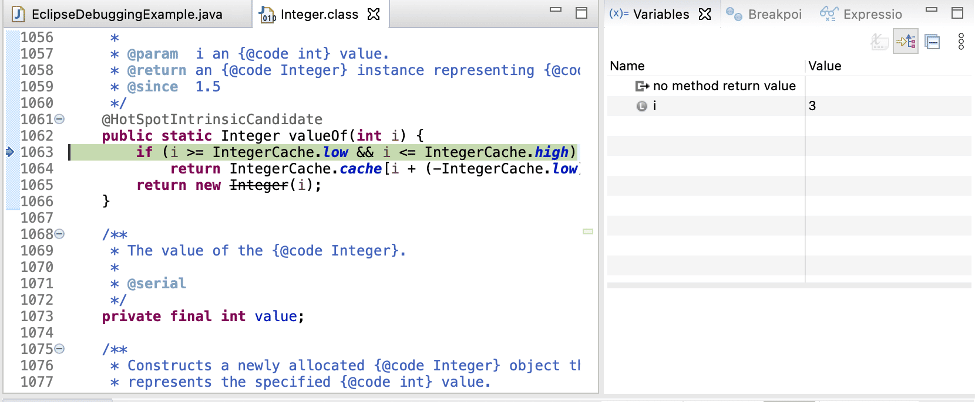
Because line 12 in the EclipseDebuggingExample class is trying to print out the value of an integer, it calls the valueOf method in the Java.lang.Integer class and the debugger dives in there.
This can be avoided by creating a Step Filter using the following steps:
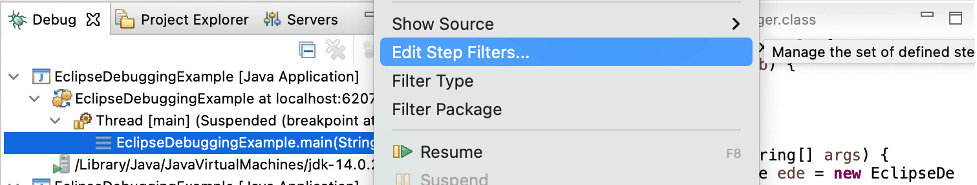
- In the Debug view, right-click on any item in the pane that contains the daemon thread and select Edit Step Filters:
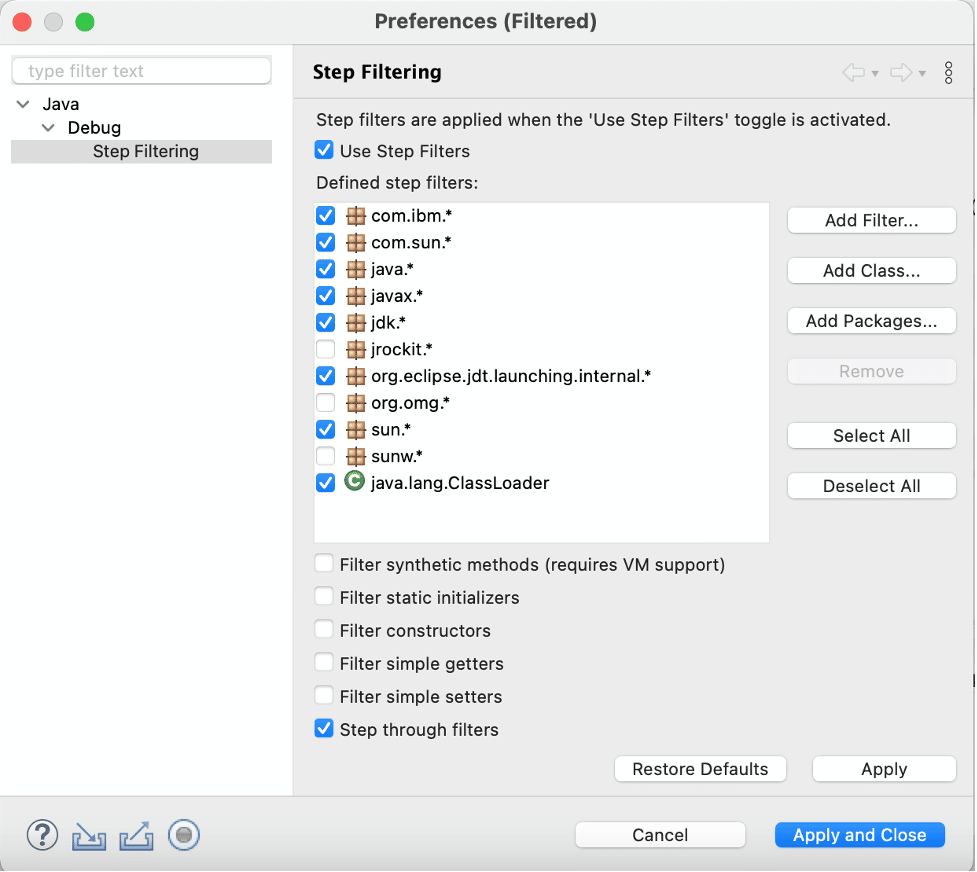
- In the popup window, check the Use Step Filters box. Enable the packages that you want to filter out and press Apply and Close:
- Now when you press Step Into, it will no longer go to the
Integer.classcode:
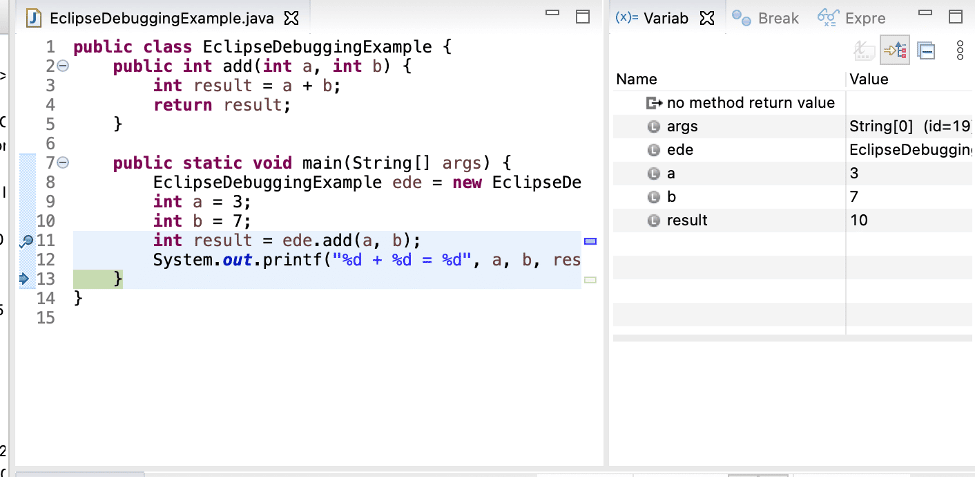
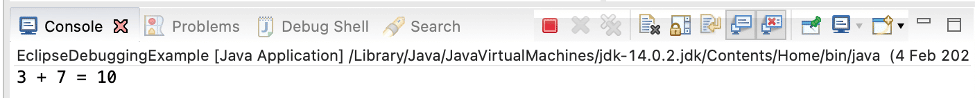
Step Nine: Print The Result
At this point, line 12 executes and prints the result to the Console successfully:
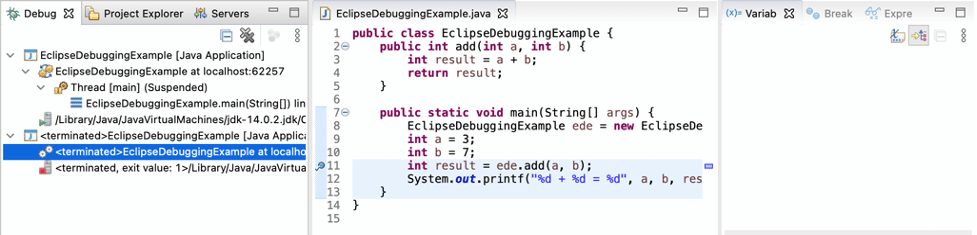
Step Ten: Stop in Main
The debugger can now be stopped by pressing the Terminate icon in the toolbar:

The debugger will now be disconnected:
Track, Analyze and Manage Errors With Rollbar
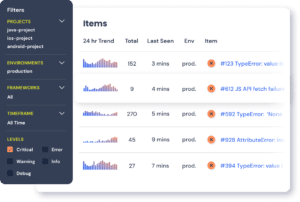
Managing and debugging issues in your code is challenging. It can make deploying production code an unnerving experience. Rollbar can track and debug Java bugs as well as analyze and manage errors in real-time to help you to proceed with more confidence. Try it today!